

Technological advances in agriculture, aquaculture, energy, remote sensing and related sectors are producing numerous large high resolution and high-frequency data sets. As a world-leader in agricultural and environmental sciences, UC Davis is in a unique position on the data science map and puts CeDAR in a position to significantly enhance understanding of agricultural, environmental, and climate systems.
Such great understanding in these areas propels the development of solutions to problems of great importance to the people of California, and provides evidence to evaluate and inform environmental policy.
How do price changes affect agricultural land use and nitrate pollution?
Aaron Smith
changes on nitrogen pollution.
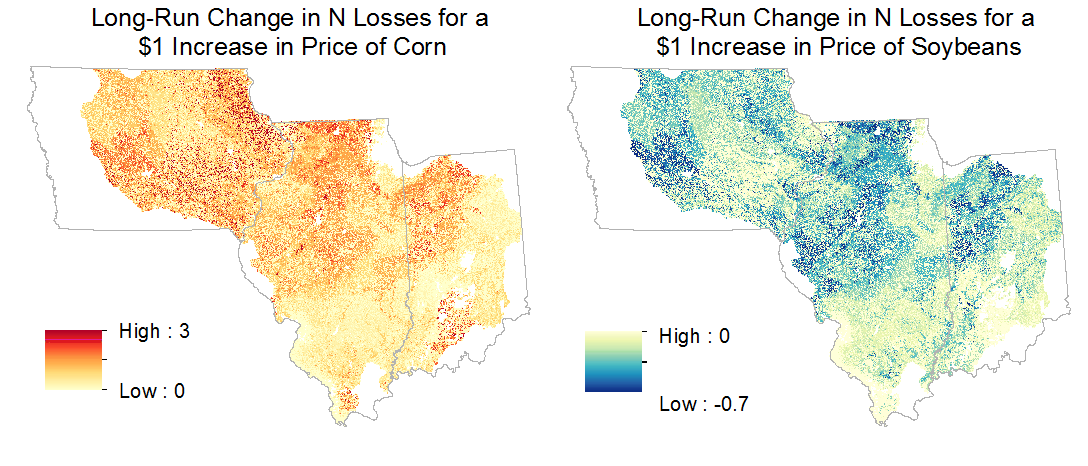
High corn prices cause farmers to plant more corn on fields that were planted to corn in the previous year, rather than alternating between corn and soybeans. Cultivating corn after corn requires greater nitrogen fertilizer and some of this nitrogen flows into waterways and causes environmental damage. We use field-level data to estimate the effect of crop prices on agricultural land use and nitrogen losses. Our sample contains more than 8 million observations derived from satellite imagery and includes every cultivated field in Iowa, Illinois, and Indiana. We find that that aggregate crop acreage responds more to price shocks in the short run than in the long run, which contradicts the long-held belief that agricultural supply responds gradually to price shocks through partial adjustment. Spatial variation in these high-resolution estimates highlights the fact that the environmental effects of agriculture depend not only on what is grown, but also on where and in what sequence it is grown. Our results suggest that the change in corn and soybean prices due to a billion gallons of ethanol production expands the size of the hypoxic zone in the Gulf of Mexico by roughly 30 square miles on average.
How do energy efficiency improvements affect energy use?
Aaron Smith
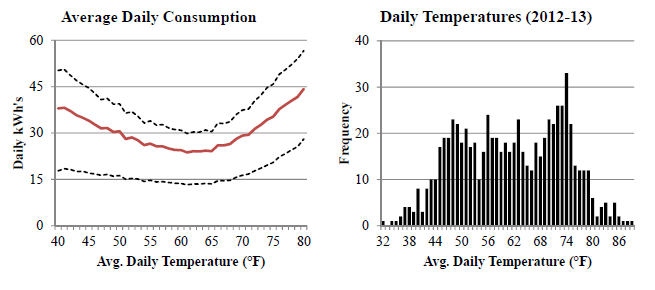
In 1978, California adopted building codes designed to reduce the energy used for temperature control. Using a rich dataset of hourly electricity consumption for 158,112 California houses, we estimate that the average house built just after 1978 uses 8% to 13% less electricity for cooling than a similar house built just before 1978. Comparing the estimated savings to the policy’s projected cost, our results suggest the policy passes a cost-benefit test. In settings where market failures prevent energy costs from being completely passed through to home prices, building codes can serve as a cost-effective tool for improving energy efficiency. In a related study using the same data, we analyze the effect of an air conditioner upgrade on the timing and magnitude of residential electricity use. We estimate that the average participating household saved $6.46 per month during the summer, but the 20% of households that were the heaviest electricity users saved $26.56 per month. Most of these savings occurred after 7pm.
‘Effortless Perfection:’ Do Chinese cities manipulate air pollution data?
Dalia Ghanem and Junjie Zhang
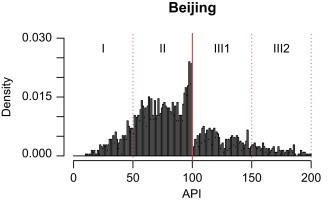 Unique data on daily air pollution concentrations over the period 2001–2010 was used to test for manipulation in self-reported data by Chinese cities. First, a discontinuity test was employed to detect evidence consistent with data manipulation. Then, a panel matching approach was proposed to identify the conditions under which irregularities may occur. It was found that about 50% of cities reported dubious PM10 pollution levels that led to a discontinuity at the cut-off. Suspicious data reporting tends to occur on days when the anomaly is least detectable. The findings indicate that the official daily air pollution data are not well behaved, which provides suggestive evidence of manipulation.
Stage-specific, Nonlinear Surface Ozone Damage to Rice Production in China
Colin A. Carter, Xiaomeng Cui, Aijun Ding, Dalia Ghanem, Fei Jiang, Fujin Yi & Funing Zhong
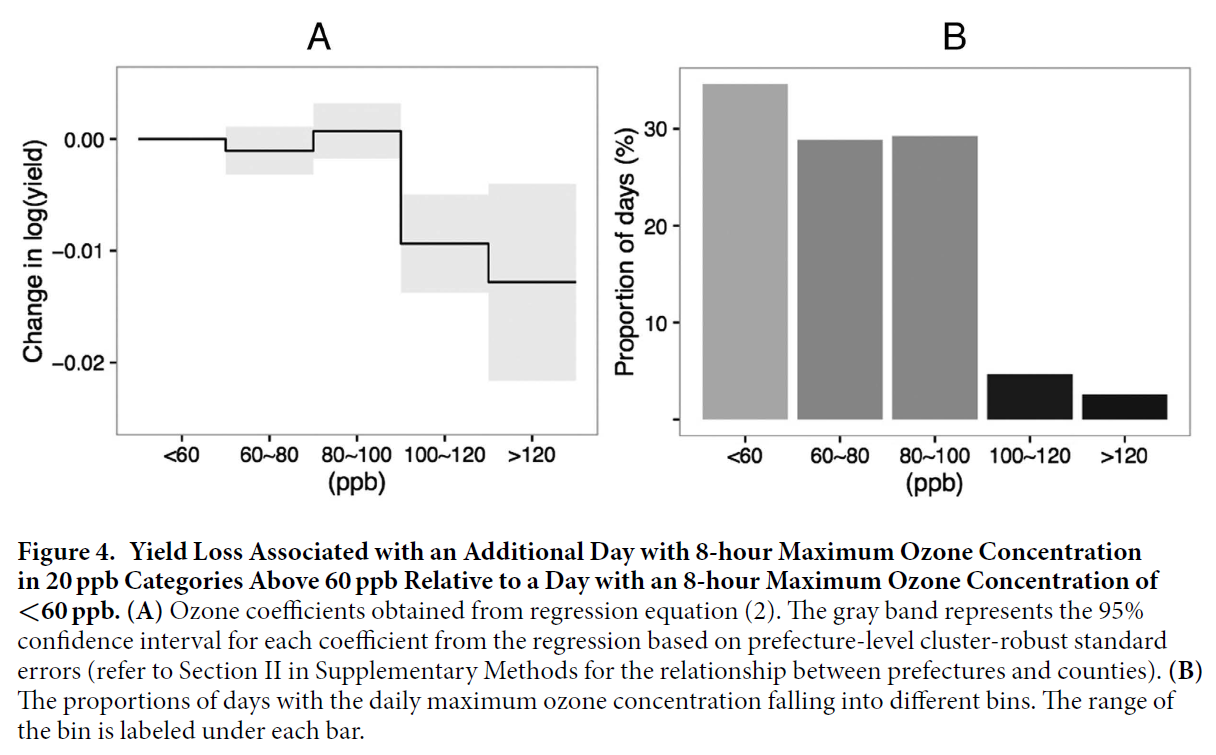 China is one of the most heavily polluted nations and is also the largest agricultural producer. There are relatively few studies measuring the effects of pollution on crop yields in China, and most are based on experiments or simulation methods. We use observational data to study the impact of increased air pollution (surface ozone) on rice yields in Southeast China. We examine nonlinearities in the relationship between rice yields and ozone concentrations and find that an additional day with a maximum ozone concentration greater than 120 ppb is associated with a yield loss of 1.12% ± 0.83% relative to a day with maximum ozone concentration less than 60 ppb. We find that increases in mean ozone concentrations, SUM60, and AOT40 during panicle formation are associated with statistically significant yield losses, whereas such increases before and after panicle formation are not. We conclude that heightened surface ozone levels will potentially lead to reductions in rice yields that are large enough to have implications for the global rice market.
Bright Spots and Blinds Spots of Water Research in Latin America
Samuel Sandoval Solis
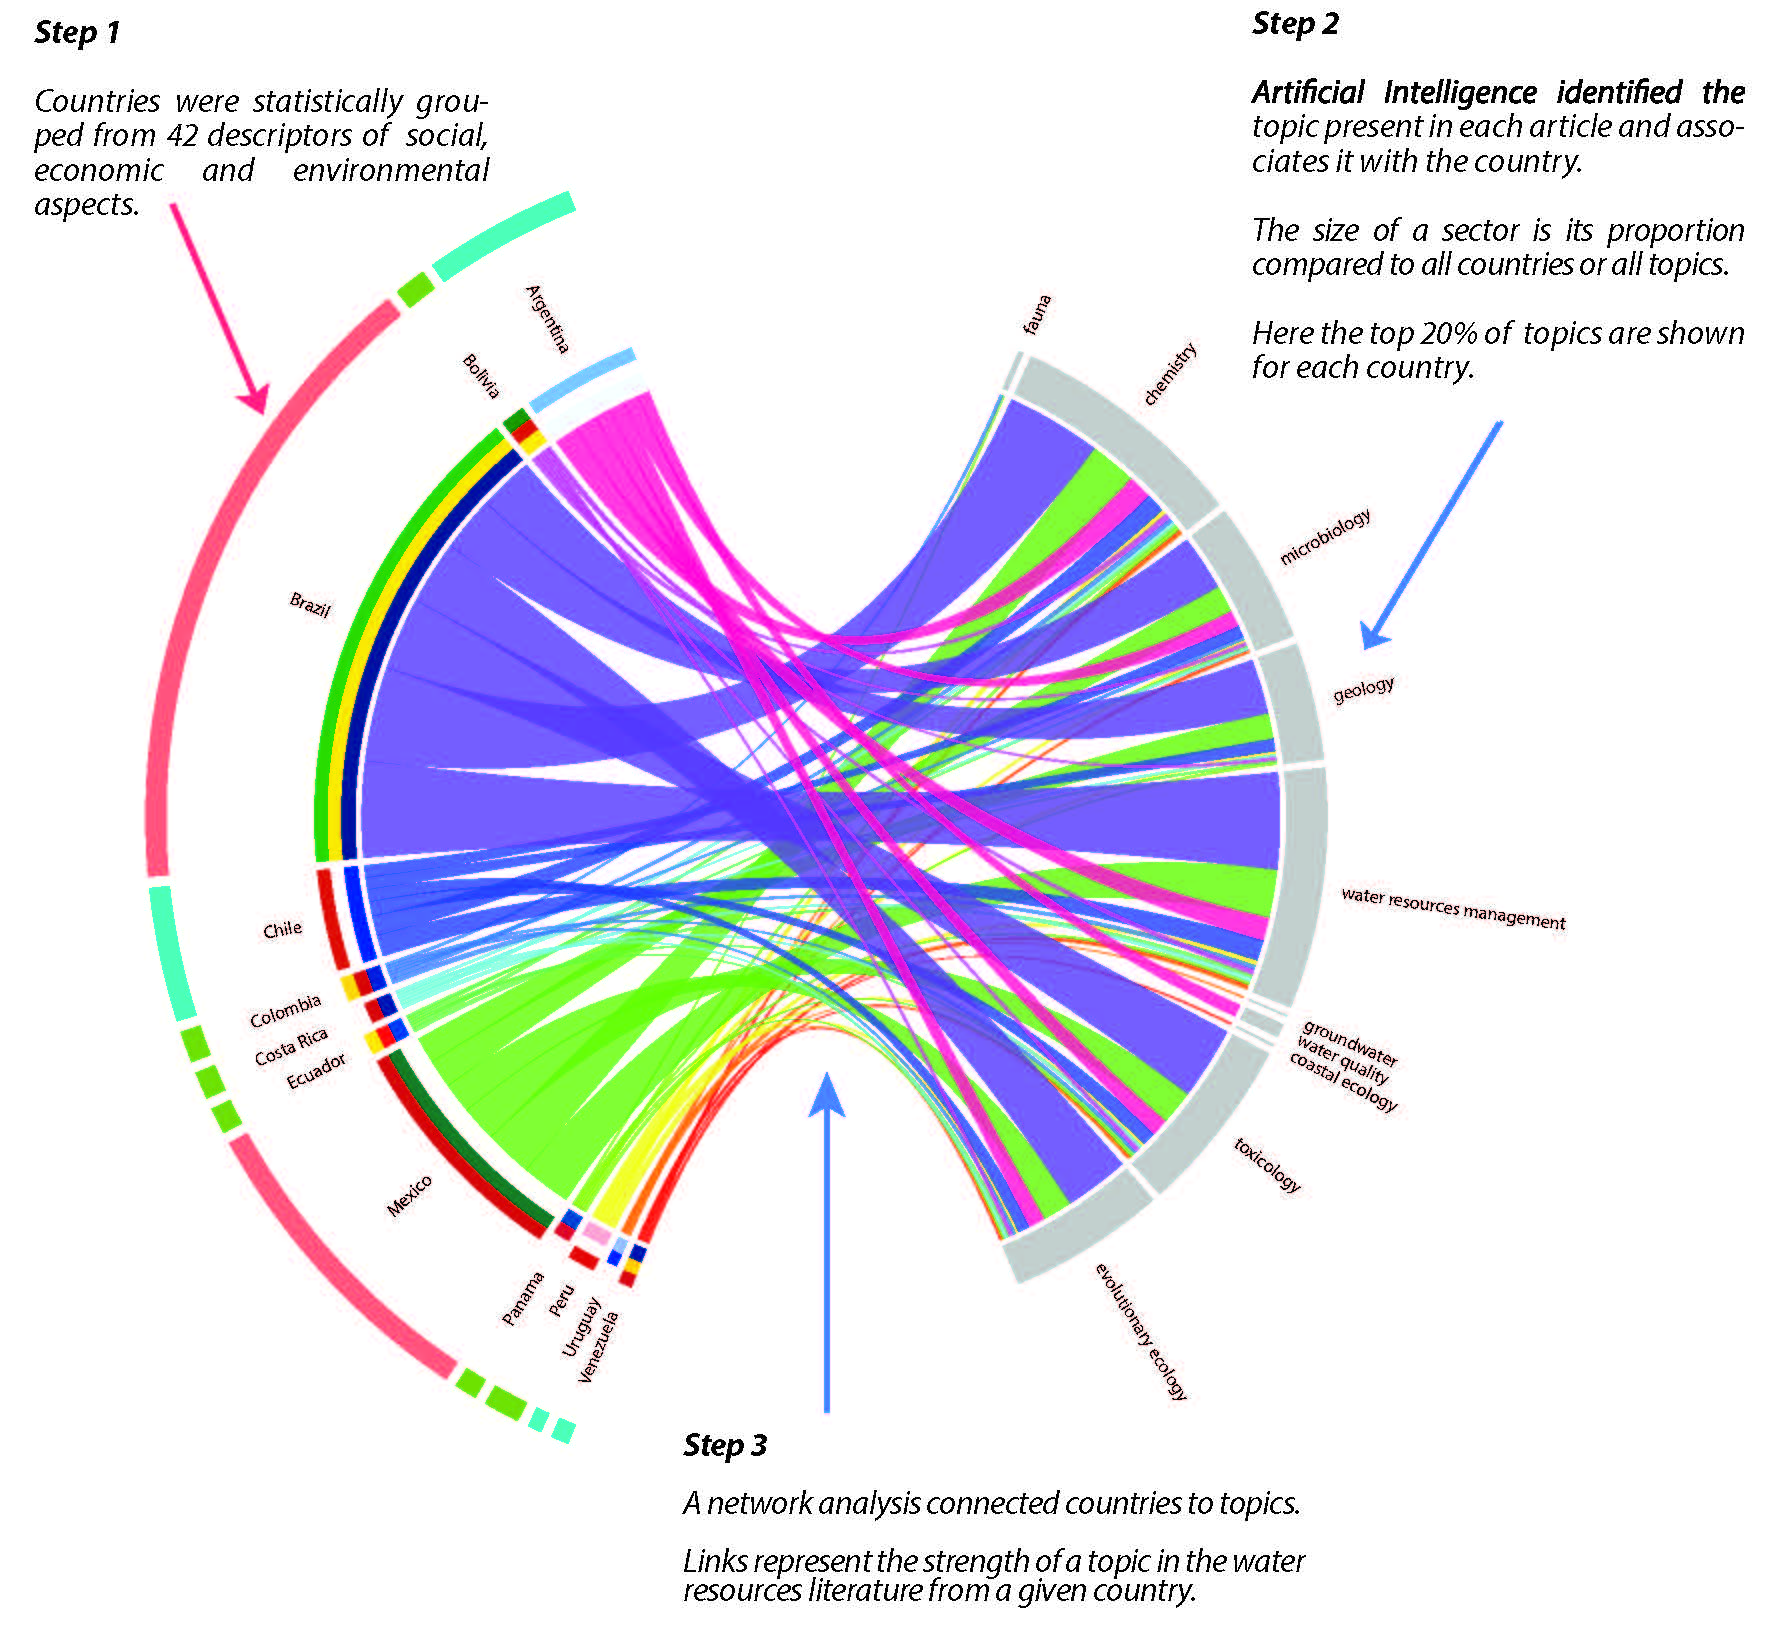
Global health, ecosystem function, and economic prosperity are unquestionably linked to successful management of water resources, which requires sufficient and equitably distributed research across spatial, time, and climatic scales. This research identifies research opportunities for water resources management in Latin America. We conducted an unprecedented literature review of over 30,000 multilingual articles on water resources research through the use of Latent Dirichlet Association (LDA). Topic modeling was validated through cross-validation with a training set of human-derived topics. A database was built to include results from the LDA analysis and biophysical and economic country descriptors in order to correlate countries’ populations, economies, natural resources, climate, and governmental structures to the state of their water resources research. Georeferenced relationships between the LDA results and country descriptors revealed bright spots and knowledge gaps, and a network model identified the strongest and weakest connections between topics in water resources research. A systems dynamics model identified country characteristics that are driving the prevalence or lack of research in certain water resources topics. All of these results were ground-truthed with an electronic survey sent to academic researchers throughout Latin America. The results from this research emphasize the need for a more equitable distribution of resources, both financial and human, throughout Latin America to ensure the future safety and success of the region.
Predicting Reach-Scale Geomorphic Channel Types in the Sacramento Basin
Samuel Sandoval Solis
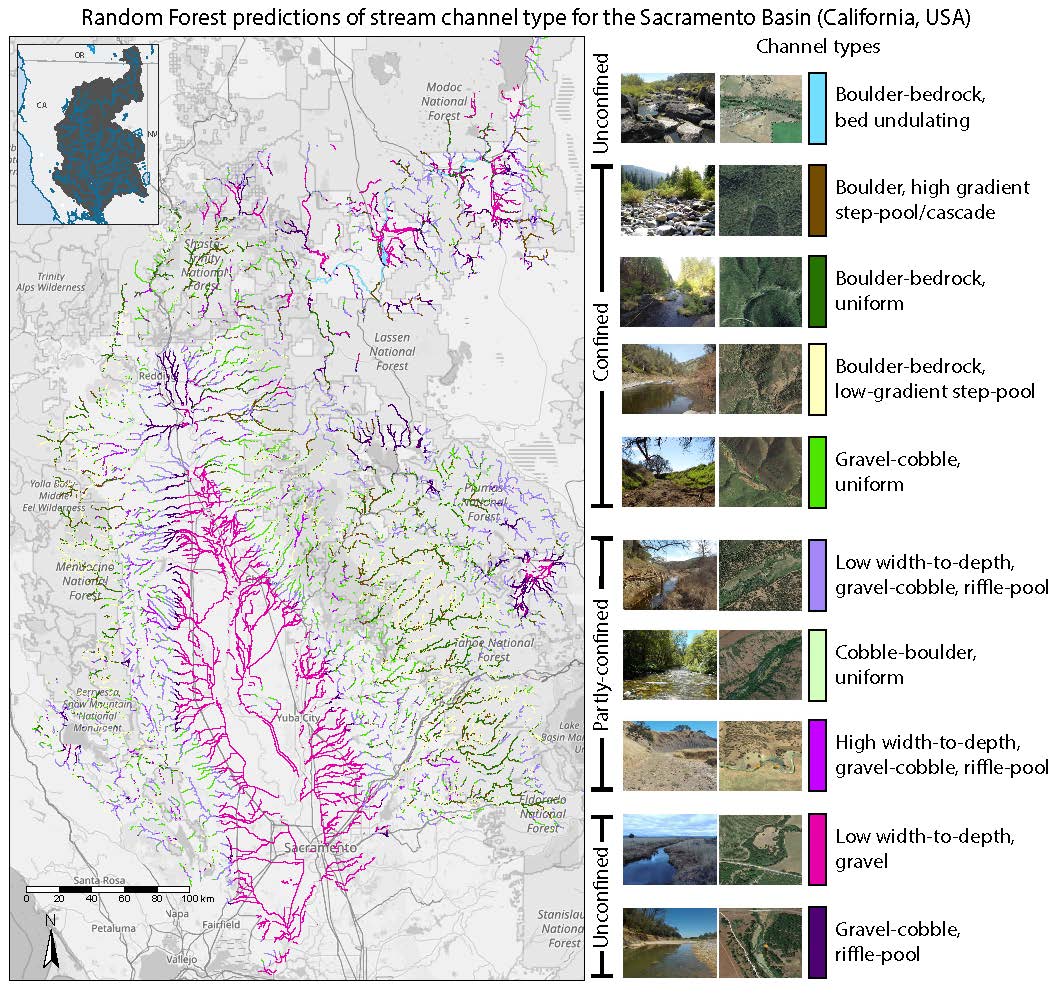
Hydrologic and geomorphic classifications have gained traction in response to the increasing need for basin-wide water resources management. Regardless of the selected classification scheme, an open scientific challenge is how to extend information from limited field sites to classify tens of thousands to millions of channel reaches across a basin. To address this spatial scaling challenge, this research leveraged machine learning to predict reach-scale geomorphic channel types using publicly available geospatial data. A bottom-up machine learning approach selected the most accurate and stable model among ~20,000 combinations of 287 coarse geospatial predictors, pre-processing methods and algorithms in a three-tiered framework to: (i) define a tractable problem and reduce predictor noise with Data Complexity Measures; assess model performance (ii) in statistical learning; and (iii) in prediction. This research also addressed key issues related to the design, interpretation and diagnosis of machine learning models in hydrologic sciences. In an application to the Sacramento River basin (California, USA), the developed framework selected a Random Forest model to predict 10 channel types previously determined from 290 field-surveys over 108 943 200-m reaches. Performance in statistical learning is reasonable and the predictions coherently capture the large-scale geomorphic organization of the landscape. Interestingly, in the study area, the persistent roughness of the topography partially controls channel types and the variation in the entropy-based predictive performance is explained by imperfect training information and scale mismatch between labels and predictors.